

- Tracking model performance regressions.
- Coordinating shared evaluation workflows.
Leaderboard creation is only available for the Weave UI and Weave Python SDK. TypeScript users can create and manage leaderboards using the Weave UI.
Create a leaderboard
You can create a leaderboard through the Weave UI or programmatically. Choose the UI approach for ad-hoc comparisons, or the Python SDK to integrate leaderboard creation into automated evaluation workflows.Use the UI
Use the Weave UI to create and customize leaderboards interactively. Follow these steps:- In the Weave UI, navigate to the Leaders section. If it’s not visible, click More → Leaders.
- Click + New Leaderboard.
- In the Leaderboard Title field, enter a descriptive name (for example,
summarization-benchmark-v1). - Optionally, add a description to explain what this leaderboard compares.
- Add columns to define which evaluations and metrics to display.
- When the layout is ready, save and publish your leaderboard to share it with others.
Add columns
Columns define what your leaderboard displays for each model. Each column in a leaderboard represents a metric from a specific evaluation. To configure a column, you specify:- Evaluation: Select an evaluation run from the dropdown (must be previously created).
- Scorer: Choose a scoring function (for example,
jaccard_similarityorsimple_accuracy) used in that evaluation. - Metric: Choose a summary metric to display (for example,
meanortrue_fraction).
- Move before or after. Reorder columns.
- Duplicate. Copy the column definition.
- Delete. Remove the column.
- Sort ascending. Set the default sort for the leaderboard (click again to toggle descending).
Use the Python SDK
Use the Python SDK to define, publish, and retrieve leaderboards in code. This approach lets you version leaderboards alongside your evaluation code and run them as part of an automated workflow. To create and publish a leaderboard:-
Define a test dataset. You can use the built-in
Dataset, or define a list of inputs and targets manually: -
Define one or more scorers:
-
Create an
Evaluation: -
Define models to be evaluated:
-
Run the evaluation:
-
Create the leaderboard:
-
Publish the leaderboard.
-
Retrieve the results:
End-to-end Python example
The following example uses Weave Evaluations and creates a leaderboard to compare three summarization models on a shared dataset using a custom metric. It creates a small benchmark, evaluates each model, scores each model with Jaccard similarity, and publishes the results to a Weave leaderboard.View and interpret the leaderboard
After the script publishes the leaderboard, use the Weave UI to inspect the results and compare model performance side by side:- In the Weave UI, go to the Leaders tab. If it’s not visible, click More, then select Leaders.
- Click the name of your leaderboard, for example
Summarization Model Comparison.
model_humanlike, model_vanilla, model_messy). The mean column shows the average Jaccard similarity between the model’s output and the reference summaries.
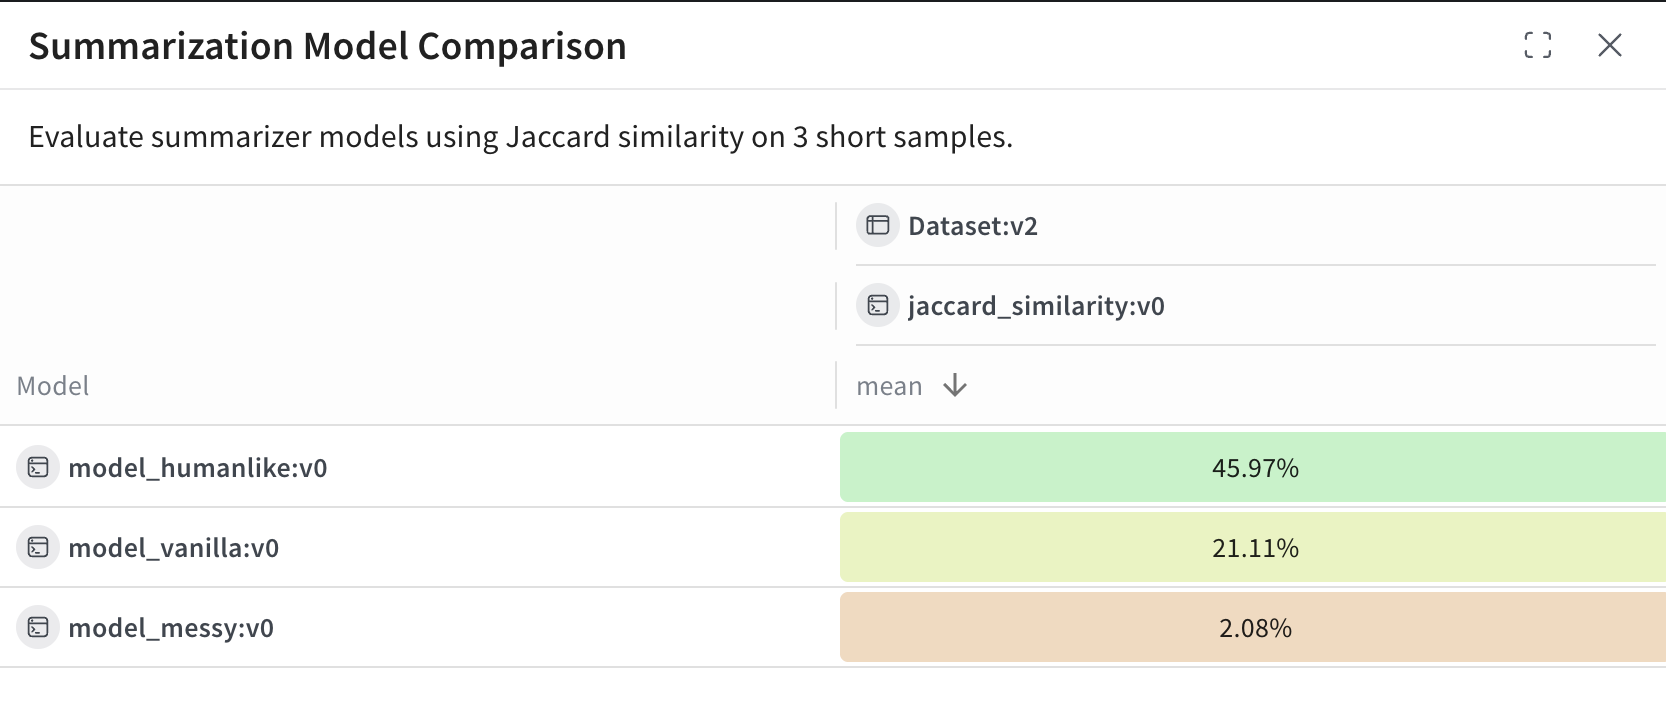
model_humanlikeperforms the best, with approximately 46 percent overlap.model_vanilla(a naive truncation) gets approximately 21 percent.model_messy, an intentionally bad model, scores approximately 2 percent.